Category Archives: Technical

Turning multiple values into one string in Power BI

Or concatenating if you will, but I don’t always remember that word which is probably why the solution didn’t come to me at once when I ran into the problem.

Concatenation is taking two or more values and chaining them, often with a delimiter. Like the first and last name of a person, or a zip code and the name of the area.

This demo data set is made up by looking at a persons grades in different classes they have taken. So if we want to show that information for all persons we would typically show it in a table like this.

Now what if we didn’t care to much about the grades for now, and wanted to show which classes a person had taken. We could of course just remove the Grade column and keep the table, but what if we only want to have one row per person? My gut feeling was playing with the matrix in Power BI, but that only shows the first value since this is a text column so it’s not what I am after at all.

The answer? Concatenation in a measure. Very often concatenation is done between two columns, but here I need it done on rows so the CONCATENATEX function is what we want. First I made this measure

Classes non distinct = CONCATENATEX(Example,Example[Class],”, “)

which gave this result

Looks ok, but the total row has duplicates in it and if we had grades for several years we would have it on each person as well if they had taken the same class several times and I only want the distinct values. Luckily we can then use the VALUES function to only get distinct values in a column so the measure now looks like this.

Classes = CONCATENATEX(VALUES(Example[Class]),Example[Class],”, “)

Which gives this result

Perfect! This can now be filtered and used like any other measure.

Retry Failed Connections in Talend

In a project we are using Talend to load a lot of data each night and we are experiencing randomly getting “Connection does not exists” error messages during our data load. This can happen at any time both during the connection phase, and so far we have been unable to see any real signs of why it is happening and when. In addition this leads connection reset often leads to our data being corrupt and unusable meaning we have to start all over. We have therefore set up an error handling when reading from this data source.

Setting up a try/catch in Talend

  1. Create a context variable that we call continueLooping. This boolean will be used to end our loop when we reach our maximum number of attempts or the connection has been successful
  2. Add a tJava where you initialize the variable to true
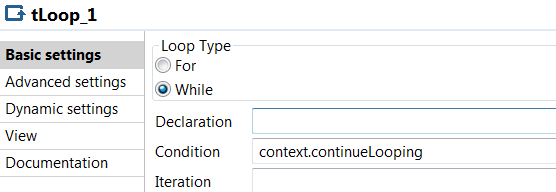
  3. Then add a tLoop as a While and condition context.continueLooping
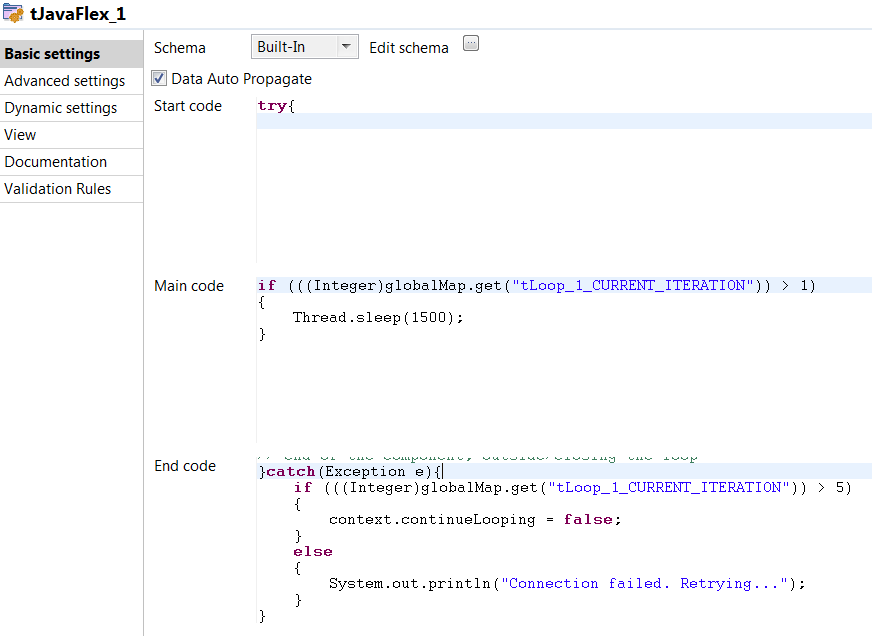
  4. Now we add a tJavaflex where our try/catch block will be. Put the try block in the start code and the catch block in the end code. Mine look something like this. Feel free to add some logging in here as well so you can keep track of where the error is happening. in the main code I make the job sleep for a little while in order to give our connection some time to get back up.
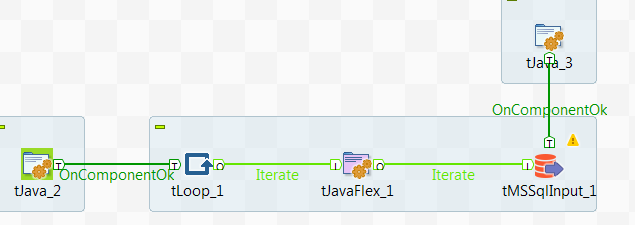
  5. Add a tJava with a “On component Ok” trigger on your database connection. Here set the continueLooping to false to stop the loop.

In the end it should look something like this:

Extending the error handling

In our case we are already looping our read by using a job above this one to read data one month at a time. The output of this job is large .csv files which we then upload to Azure blob storage in order to use Polybase to finally move the data into our SQL DWH data warehouse. Since we know we can loose connection in the middle of our read we need to clean up our .csv files before starting the loop all over for the month that we are reading. This is done by adding an If trigger on the tJavaflex where our trigger is to check which iteration we are in. If we are not in the first iteration of our loop something has gone wrong and we need to do some cleanup to make sure our data is correct in the end. We therefore remove all rows for the month we are supposed to read before we let the loop start over. Now, the only way I have been able to do this is by creating a copy of our existing file, filter out rows for current month and then write it back as the original file. In the end it looks like this:

Overall it seems to work very nicely when we are unable to trust that our data source will keep our connection open for the whole duration.

The Little of Power BI Visualization Design – Part 2

Continuing our journey on applying Andy Kirks tips and tricks from his series “The Little of Visualization Design” we are now at part 2, Clever Axis Scaling. As last time I suggest you read his post first so we already have some common ground.

Why use clever axis scaling

Clever axis scaling is a tool in order to create some drama in your visualization. It can also help you highlight values and draw your consumers eye towards it. Things that stand out will get attention, our brain is simple in this regard, and in this case that is what we are after.

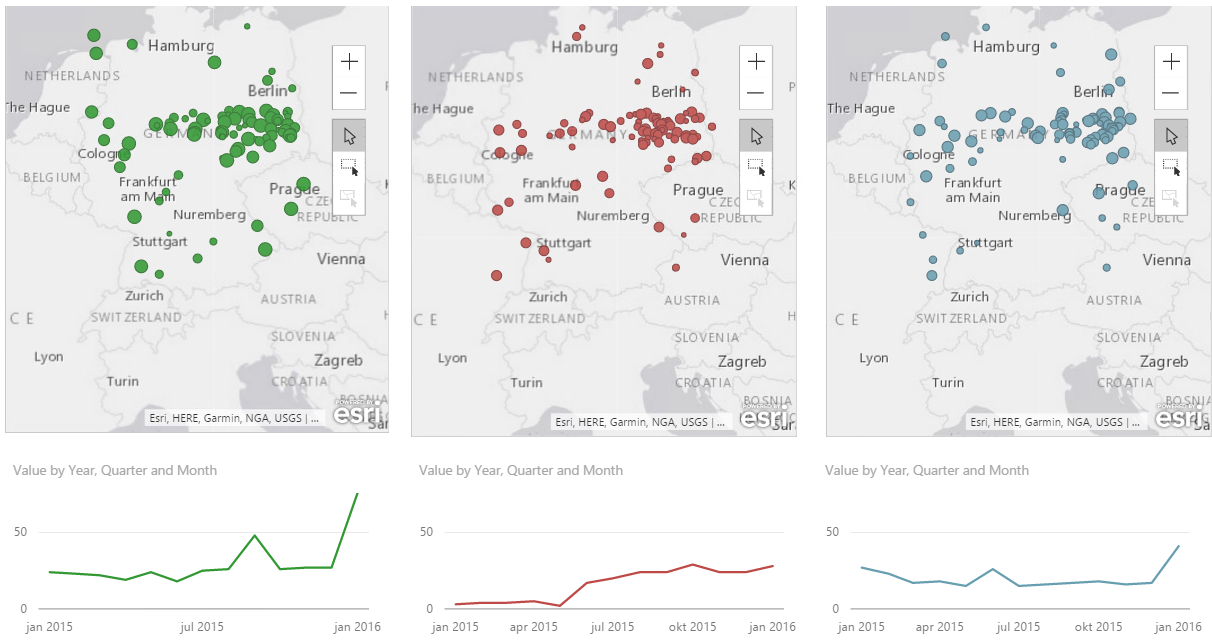
In the example the y-axis is set to 50, but the maximum value is 76. Now, my quick thought was “Great! this is easy, lets just set the y-axis to 50 so the helper line is 50”. This is easy to do, however the chart actually gets cut at 50. So it ends up looking the image below, which is not what we want at all. We are now hiding the most interesting data!

Max y-axis value set to 50 truncates your graph

So I tried setting it to 100. Now, that works okay, but the highest line on the y-axis is now not 50 so the dramatic effect of 76 shooting way above the last helper line on the y-axis disappears even though we still see the biggest increase on the chart to the left. So what is the solution? You need to try out what works best with your data. In this case it seems to work fine to choose 76, the maximum value in the chart. Now this will not always be the case because we can not control how many lines on the y-axis we get. If I make the chart higher you can see that the y-axis changes with numbers as well.

Trying out different max values on the Y-axis

Different heights can remove some of the effect we are after

Use it carefully

This solution also has the drawback that you are hardcoding the minimum and maximum value. So if you suddenly have a value higher than 76 you will loose it! In the end it comes down to what you want to tell with your chart, if your chart is going to change values often and how dramatic you want it. If you have no idea how your numbers will behave in the future I will not advice you to hard code min/max values unless you need it for a specific occation like a presentation. When you are done with that spesific occasion I suggest you turn them back to automatic to minimize confusion.

Final result

As with all tools PowerBI has some limitations compared to custom code and for example using something like D3.js where you can do absolutely everything you want! Having these limitation can make it a challenge to use all these tips and tricks  going forward, but we will do the best we can! In this case we might have some problems trying to create a more dramatic effect in our storytelling. Both with your axis’ as we have seen here, but also with data labeling as PowerBI does not let you choose which data points to highlight. So if you try to label the highest value without hovering over it it is not possible. Or at least I didn’t manage to, but if you do please let me know how you did it.

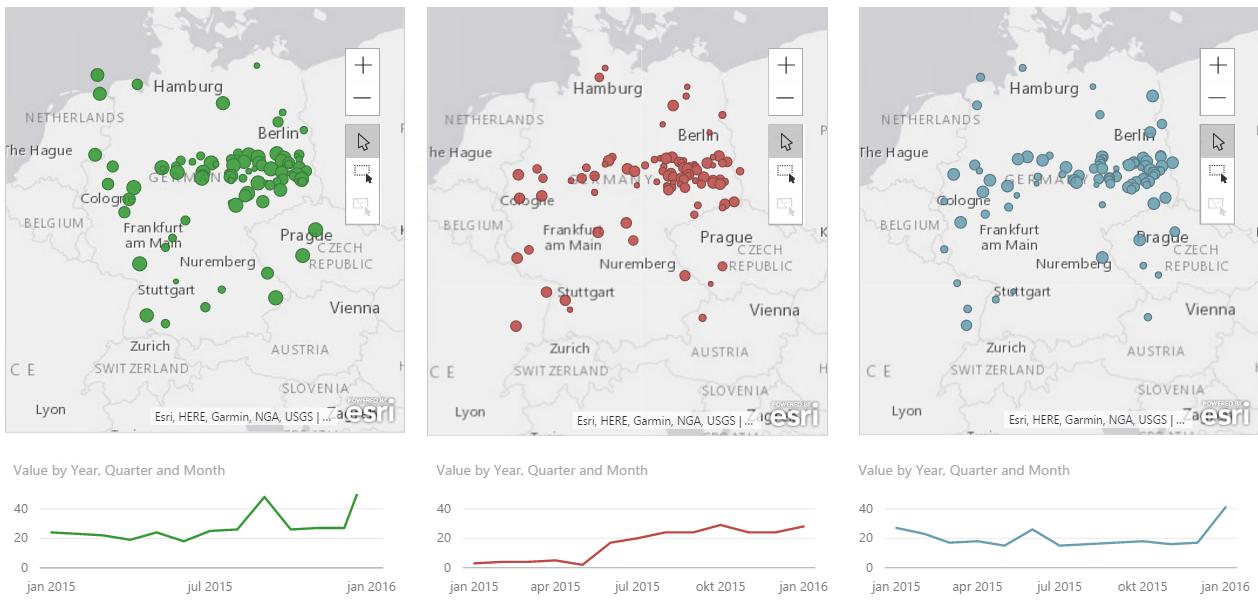
Also, if anyone has a way of hiding the ESRI logo in Power BI Desktop please let me know. They are not pretty and are driving me crazy!

“The Little of Visualization design” – with Power BI

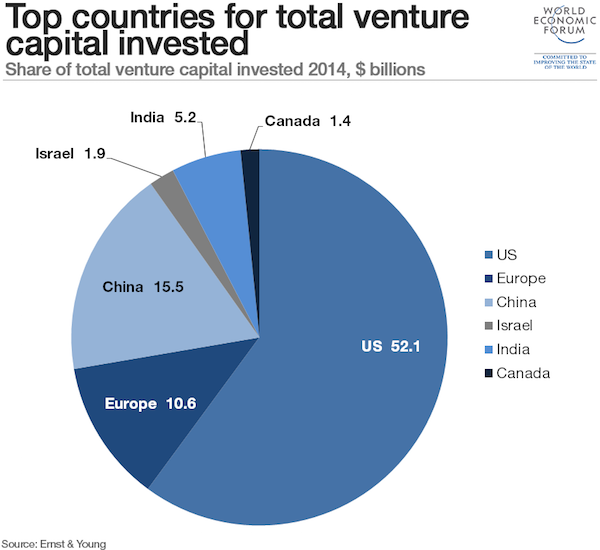
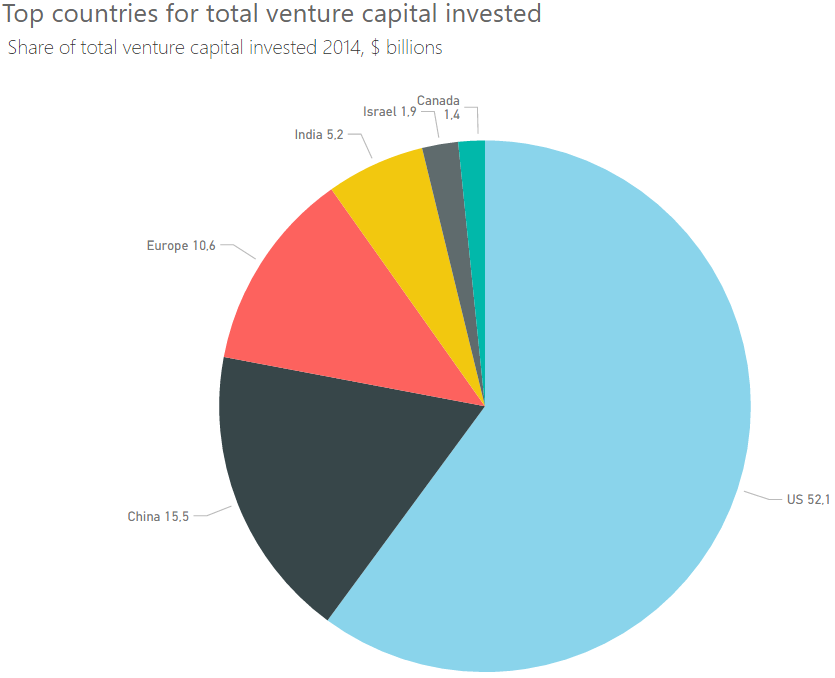
Andy Kirk has an excellent series called “The Little of Visualization Design” where he gives small tips and tricks that can improve your data visualizations. If you have not seen it I strongly recommend it. Now, what I am going to try and do every week after summer vacation is to try and show you have you can take these tricks and use them with Power BI. But let’s kick start it now with part 1, dual labeling. I  suggest that you read the original post by Andy first so we are at a common ground about what we are going to look at which is this pie chart.

Dual labeling. It is suprisingly normal to see and it generates more cluster on your data visualisation than you need. Repeating something will not make things clearer, it will just create more ink on your graph and make it harder to focus on what’s important.

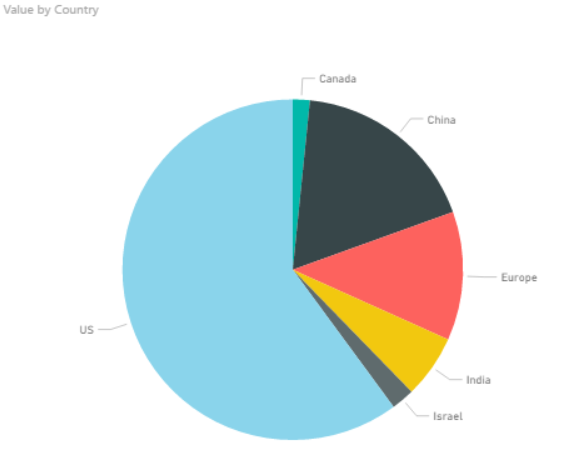
Now if you punch in the data and create a pie chart in Power BI we get what is shown below.

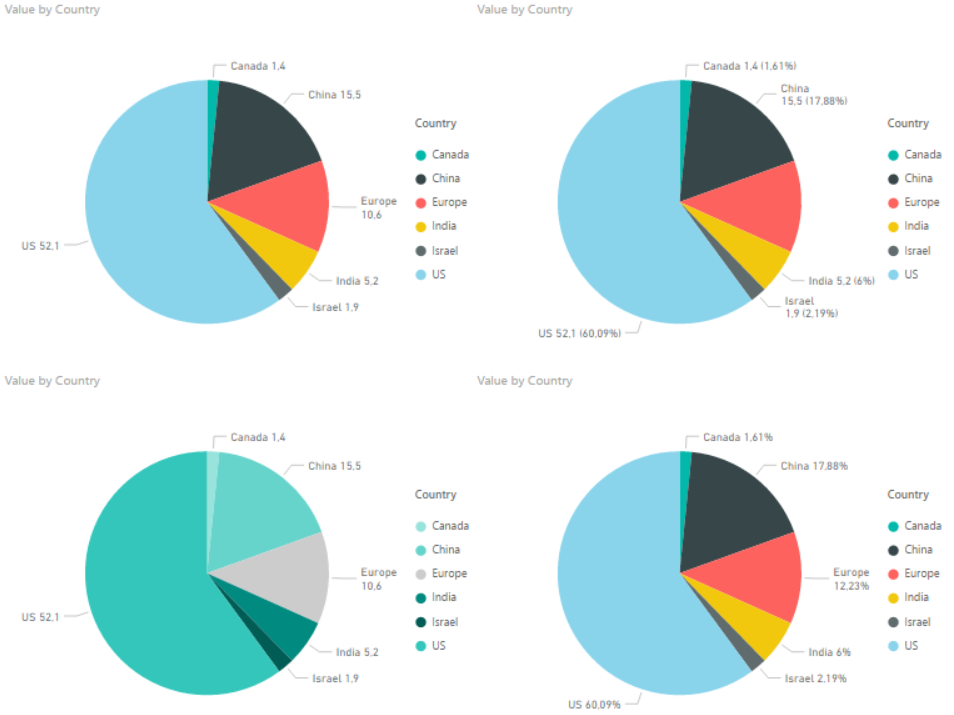
So Power BI does not provide you with a dual labeling issue at front, but it is quite easy to reproduce it with Power BI. In the “Format” pane you have a bunch of options which usually are great, but you have to use it with care and have a clear vision of why you are changing the original chart if not you can end up with all of these different variations.

The one in the bottom left is probably the closest to the one in the original post. It has dual labeling, and it has quite similar colors on the pie slices. Andy Kirk’s proposed solution is to remove the labeling and provide it directly onto the pie since the colors in the original graph is so similar. Now, that doesn’t  sound to far away from the default graph that Power BI provides us with. However the default is not perfect and here is what I would do in order to improve it:

  1. In Label Style choose “Category, data value”. This makes us see the actual number.
  2. Increase font size of detail label.
  3. Increase font size of the title. In general I think all default font sizes in Power BI are too small. I always feel like I need stronger contact lenses when creating a chart…
  4. Sort the chart by value so the slices appear in order of size.
    Note: I had originally made the font size of the detail label a bit bigger. However, this made the detail label for Canada disappear. Probably because it would take up the same space as Israel. So I wish they could make the position of the label a bit more dynamic.

In the end we end up with the chart below. So all in all the default chart Power BI created wasn’t too bad, but it could be improved. And make sure you are aware that not all options in the format pane in Power BI makes your data visualisation better, it could make it worse!

I’m looking forward to some weeks of summer and then I’ll continue this series when I am back! Thanks for reading. If you have any questions or feedback drop me a comment, it is greatly appreciated.

Creating a Dynamic Dashboard of Datazen Dashboards

One of the projects I’ve used Datazen was a project that needed operational reporting. These dashboards was to be updated at least every 10 minutes and was placed on big screens around the work area where it was needed. We also created an overview, or landing page, for super users that needed to have quick access to all dashboards without waiting for the dashboards loop on the big screens.

In the beginning this landing page was just a static html site, as we didn’t want people to use the Datazen portal at that point. Every dashboard had a static thumbnail and when a user clicked on a thumbnail they were brought to the respective Datazen dashboard.

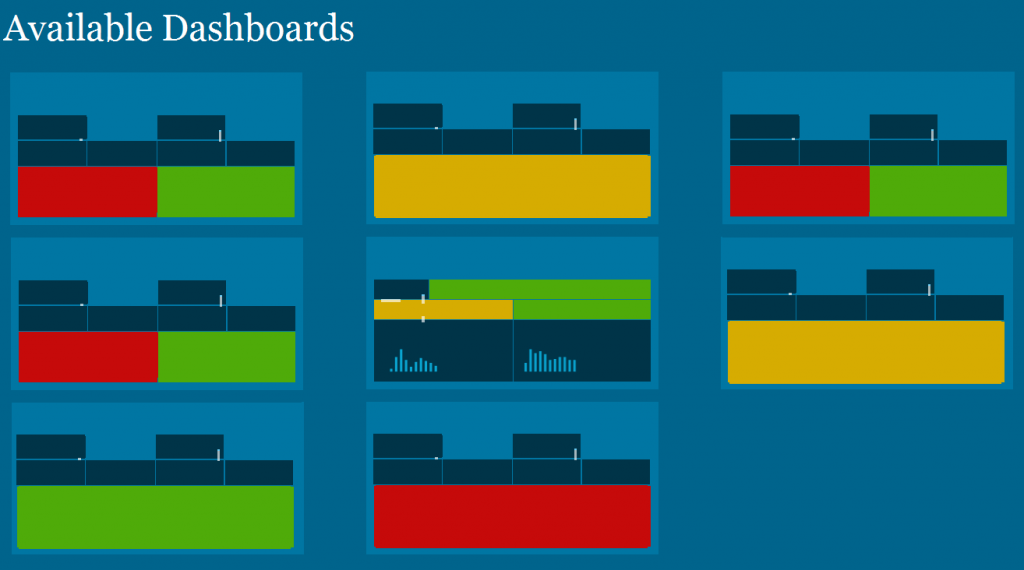
This worked fine, but it required every user to go into each dashboard to have a look at the status since the thumbnail did not change. So we decided to spend some time to create a dynamic landing page, or a dashboard of dashboards that showed real time thumbnails of the dashboards. By doing this they couldn’t necesserily see the numbers on all of the dashboards, but they would be able to see status and where things where green or red.

Datazen can be embedded in web pages by the use of iframes. Doing this gave us a more dynamic page that was refreshed when a user entered the site or after a given interval if they stayed on it. What you will notice if you try this is that a click on a dashboard will not open the dashboard itself, but instead you will be able to interact with the dashboard in the iframe. In our case, this was not what we wanted as the purpose was to just see the status and when a user clicked on a dashboard they were sent to that specific dashboard to get more details and in full screen.

In order to solve this we created a new <div> called clickCatcher with the same size as the Datazen “thumbnail”, and made transparent. This allowed us to display the dashboard in the size of a thumbanil, but open the dashboard when it was clicked instead of interacting with the small version. The code for one thumbnail is posted below.

It’s a neat little trick that made us able to create a solution that was easier, an better, for the customer. Too see how you we auto refreshed dashboard pages you can take a look here.

HTML

<div id="kpi" class="kpi">
<a href="LinkToDashboardPage" class="thumb">
<div class="clickCatcher"></div>
<iframe src="LinkToPublicDatazenDashboard" style="overflow:hidden;overflow-x:hidden;overflow-y:hidden" frameborder="0" height="157px" width="300px"></iframe>
</a>
</div>

CSS

.clickCatcher{
display: block;
background-color:rgba(255, 0, 0, 0.0);
height: 157px;
width: 300px;
position: absolute;
}

LoadingDashboards
All dashboards are refreshed when the landing page is opened

DashboardDashboardExample
How the dashboard might look. Clicking on a thumbnail will take you to the full size dashboard


Datazen Guest Authentication Will Be Missed

About a week ago a blog post was released called “Announcing End of SUpport for Datazen Products“. Now, this shouldn’t come as a surprise since Datazen is a part of Reporting Services in SQL Server 2016, more specifically mobile reports. Overall this is great news, there was however a few points I was a bit disappointed in seeing was not part of the initial release.

A really great thing that is mentioned is that a focus area has been that Datazen customers should be able to migrate to SQL Server 2016 Reporting Services easily. This is great, no need in recreating everything you have done so far, and there has been mentioned a migration tool earlier so I hope this will be a simple case once customers start migrating HUBs, users and dashboards.

My biggest dissapointment was to see that Custom authentication and Public/guest authentication is not part of the initial release, but at least on the roadmap. I have struggled with SSRS on public webpages before, and Datazen gave me an easy way of doing this. Hacking a way so that a public Sharepoint portal had to impersonate a user when a user went to pages with SSRS elements was not an easy task, and that hack also did not work when the site was migrated from SharePoint 2010 to SharePoint 2013 so we had to do it all over again. And this was even the solution that Microsoft themselves said we should go for!

Authentication via SSRS have some clear advantages, but I’m still dissapointed that there was not room for guest authentication. In the end, a lot of information is usable and important for the public, and if it is not seen what use is it? I’m crossing my fingers that this will be implemented relatively quick. If we’re lucky maybe they are able to let us use SSRS paginated reports on public sites as well!

Creating a guest user for Datazen

If you ever want to have public access to your dashboards you can get this by creating a guest user and giving that user access to the dashboards you want to be publicly available. This is great if you want to place dashboards on a web page without haveing the users to log in to see them.

You can create a guest user by creating a new user on the server with this info:
Username: guest
Mail: guest@guest.com
Name: Guest

Now, remember that this user should only have access to dashboards that is intended for everyone to see. If you give it access to everything, business critical information can be available to anyone.

Using JSON functions in SQL Server 2016

With SQL Server 2016 we are finally able to analyze and query JSON data. It is not that often I use XML, but JSON is so much used it is about time we can use it in SQL Server. In this entry I’ll let you follow me as I take a first look at it using some data from New York Times.

New York Times has a web app called Chronicle, which lets you see how many articles has mentioned specific words and this data you can also export as JSON. I chose to use the words Radio, Televion, Mail and Internet and downloaded one JSON file per word (for some reason it doesn’t work to get the data for several terms at once). I also chose to remove one of the sets of square parenthesis since our graph_data only will have one term and not a list of terms. I end up with four files that looks like this.

graph_data

So the graph_data has a term that in our case is mail, radio, television and internet and an array of data which has the number of articles containing the number of articles with the term, the year and the total number of articles published in that year so we for example can calculate a percentage of how many articles the term was in.

In order to read the JSON from the file I first load the entire file into a variable using the following code

DECLARE @ChronicleMail VARCHAR(MAX)
SELECT @ChronicleMail = BulkColumn FROM OPENROWSET(BULK'C:\Users\CTP3\Documents\JSON\MailOrg.json', SINGLE_BLOB) q;
SELECT @ChronicleMail

The last line selects the text so we can have a look at what is saved in the variable, which basicly is just one long string.

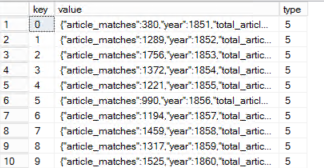
Not so interesting so far, but lets start using the new JSON functions. The JSON_VALUE function returns one scalar value from a JSON string. If you try using JSON_VALUE on something returning an array you will get a NULL returned. To get an array returned you must use the JSON_QUERY function. This is fine, but if you want to insert your data into a table the function you want to use is the OPENJOSN that lets you reference some array in your JSON and then return the elements.

JSONValueAndQuery

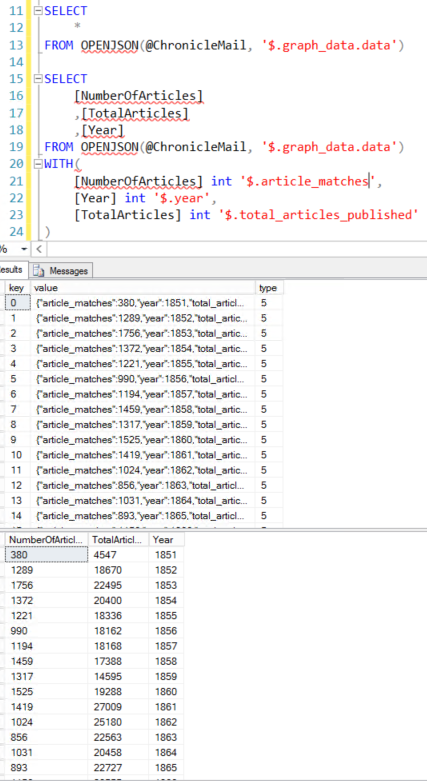
In our case the data is an array so lets call OPENJSON and call it on the data.

SELECT
    *
FROM OPENJSON(@ChronicleMail, '$.graph_data.data')
JSONData

From the result set we can see that we now have one row per year in our data. Now that is cool and all, but we kind of want the values in different columns, not the entire JSON in a column with name value. To fix this you can add a WITH clause after the OPENJSON function.

SELECT 	
	[NumberOfArticles]
	,[TotalArticles]
	,[Year]
FROM OPENJSON(@ChronicleMail, '$.graph_data.data')
WITH(
	[NumberOfArticles] int '$.article_matches',
	[Year] int '$.year',
	[TotalArticles] int '$.total_articles_published'
)
JSONDataColumns

Excellent! We now have the data in a table structure and we can insert into an actual table or do whatever we want with it. I wanted to add the term to the data so I ended up just joining it to this dataset using the JSON_VALUE function to pull only the term.

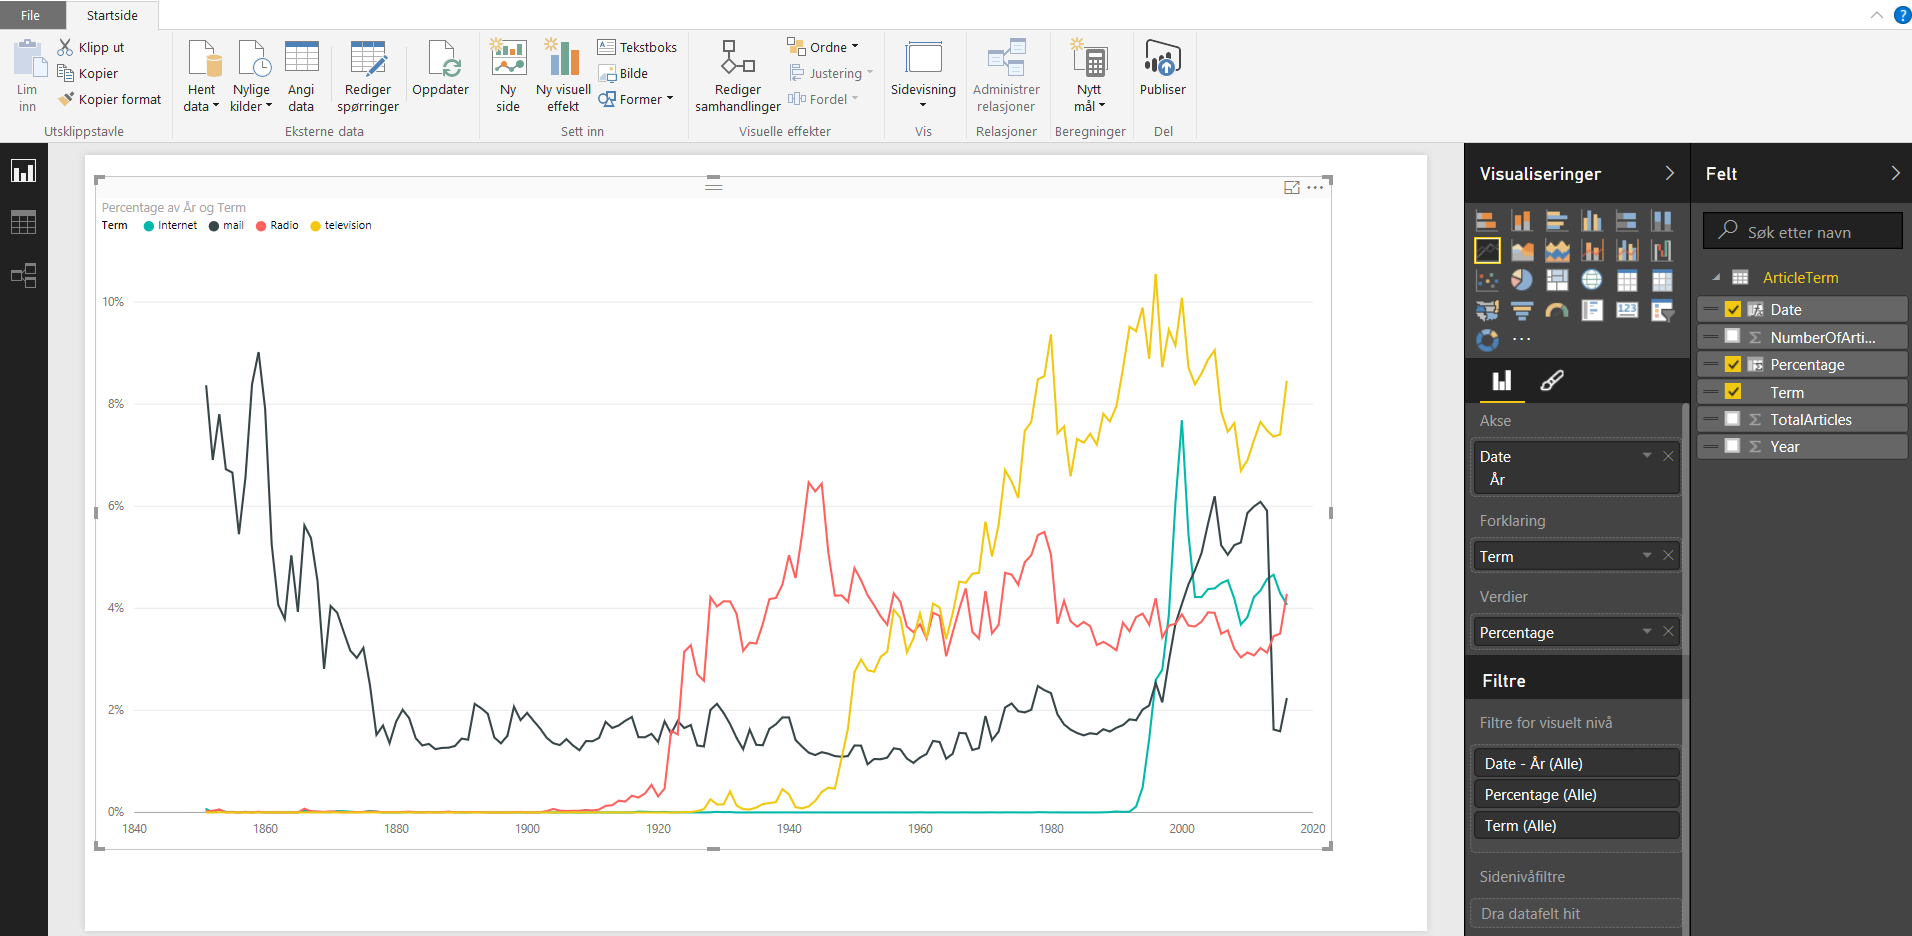
After doing this for all for files I know have a table with all terms and data for each year and I am free to use whatever tool I’d like to visualize it, f.ex PowerBI or Datazen, or since we’re in SQL Server 2016 now we can make a mobile report in SSRS. I chose PowerBI for now and added a calculation for percentage and also added year as a date to produce this.
PowerBI

Lastly, not sure if fun fact worthy, but if you would have used the OPENJSON directly on graph_data you will be able to see the key and datatype of the other elements and from this you will see that you would have to use JSON_VALUE for the key term, while the JSON_QUERY for the key data since it is an array. All in all I think these JSON functions is a great addition to SQL Server in 2016, I am sure I will be using them quite a bit!