Or concatenating if you will, but I don’t always remember that word which is probably why the solution didn’t come to me at once when I ran into the problem.
Concatenation is taking two or more values and chaining them, often with a delimiter. Like the first and last name of a person, or a zip code and the name of the area.
This demo data set is made up by looking at a persons grades in different classes they have taken. So if we want to show that information for all persons we would typically show it in a table like this.
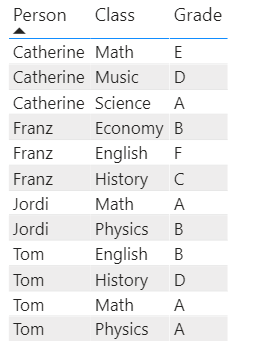
Now what if we didn’t care to much about the grades for now, and wanted to show which classes a person had taken. We could of course just remove the Grade column and keep the table, but what if we only want to have one row per person? My gut feeling was playing with the matrix in Power BI, but that only shows the first value since this is a text column so it’s not what I am after at all.
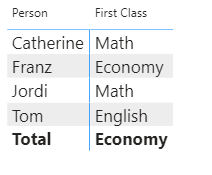
The answer? Concatenation in a measure. Very often concatenation is done between two columns, but here I need it done on rows so the CONCATENATEX function is what we want. First I made this measure
Classes non distinct = CONCATENATEX(Example,Example[Class],”, “)
which gave this result
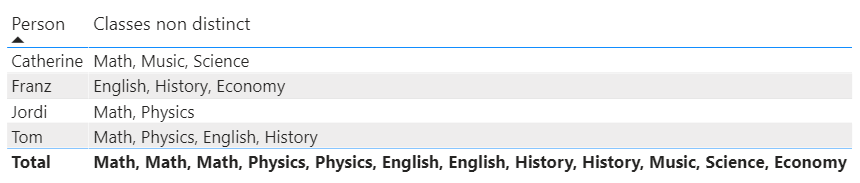
Looks ok, but the total row has duplicates in it and if we had grades for several years we would have it on each person as well if they had taken the same class several times and I only want the distinct values. Luckily we can then use the VALUES function to only get distinct values in a column so the measure now looks like this.
Classes = CONCATENATEX(VALUES(Example[Class]),Example[Class],”, “)
Which gives this result
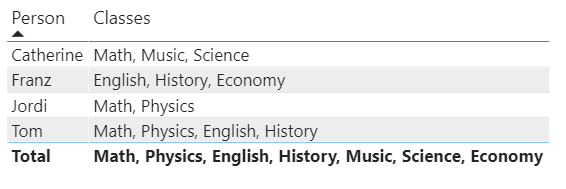
Perfect! This can now be filtered and used like any other measure.