Tag Archives: Report

One way of auto refreshing Datazen in your browser

Yesterday I saw Christopher Finlan tweet about one way of making your Datazen dashboard auto refresh. He used a Firefox add-in for this, and I’d like to show you how I have been doing this.

If you want to show Datazen on a big screen there is at this point no out-of-the-box way to auto refresh your dashboard, meaning you have to open it to get new data. If you use the browser viewer you can quite quickly create one of the simplest websites in the world to do this.

In the header of your .html file add the following line:

<meta http-equiv="refresh" content="90" />

It will make your page refresh every 90 seconds. This can also be used if you want to circle some of your dashboards, sort of like a carousel. The line below will after 30 seconds go to the specified URL instead of just refreshing the page. To complete the circle make sure to go to the first dashboard in your last dashboard.

<meta http-equiv="refresh" content="30; URL='NextDashboard'">

So what does the .html file look like for the easiest example? Something like this, just exchange “DashboardURL” with your URL:

<!DOCTYPE html>
<html>
<head>
<title>Name of Dashboard</title>
<meta http-equiv="refresh" content="90 ">
</head>
<body style="margin:0px;padding:0px;overflow:hidden">
<iframe src="DashboardURL" frameborder="0" style="overflow:hidden;overflow-x:hidden;overflow-y:hidden;height:100%;width:100%;position:absolute;top:0px;left:0px;right:0px;bottom:0px" height="100%" width="100%"></iframe>
</body>

Note: If you are going to setup an auto refresh I’d suggest you also set up your guest account so you can have access to those dashboards without having to login. You can then use the public dashboard URL in the source of your iframe.
Datazen: Personal feature requests

I’ve been using Datazen at one of my customers , and spoken about it with a bunch of other people about it, lately. People are starting to really get their eyes up for Datazen now, maybe because it’s free if you have a SQL Server Enterprise Edition license?

Anyways, I’ve met some challenges the last couple of days and I want to highlight some of them. I guess this is my way of putting in a few feature request. Maybe they are already on the roadmap, maybe not.

What am I trying to do? I need to compare two different zones with the same measure and compare it to another measure for each hour for the rest of the day. This comparison measure will change throughout the day and can also differ between the two zones. Great, I know what I am going to do! I’ll choose a “Comparison Time Graph”, choose my measures, choose hour as default time unit as and we should be good to go right? No!

Request 1: Fixed y-axis

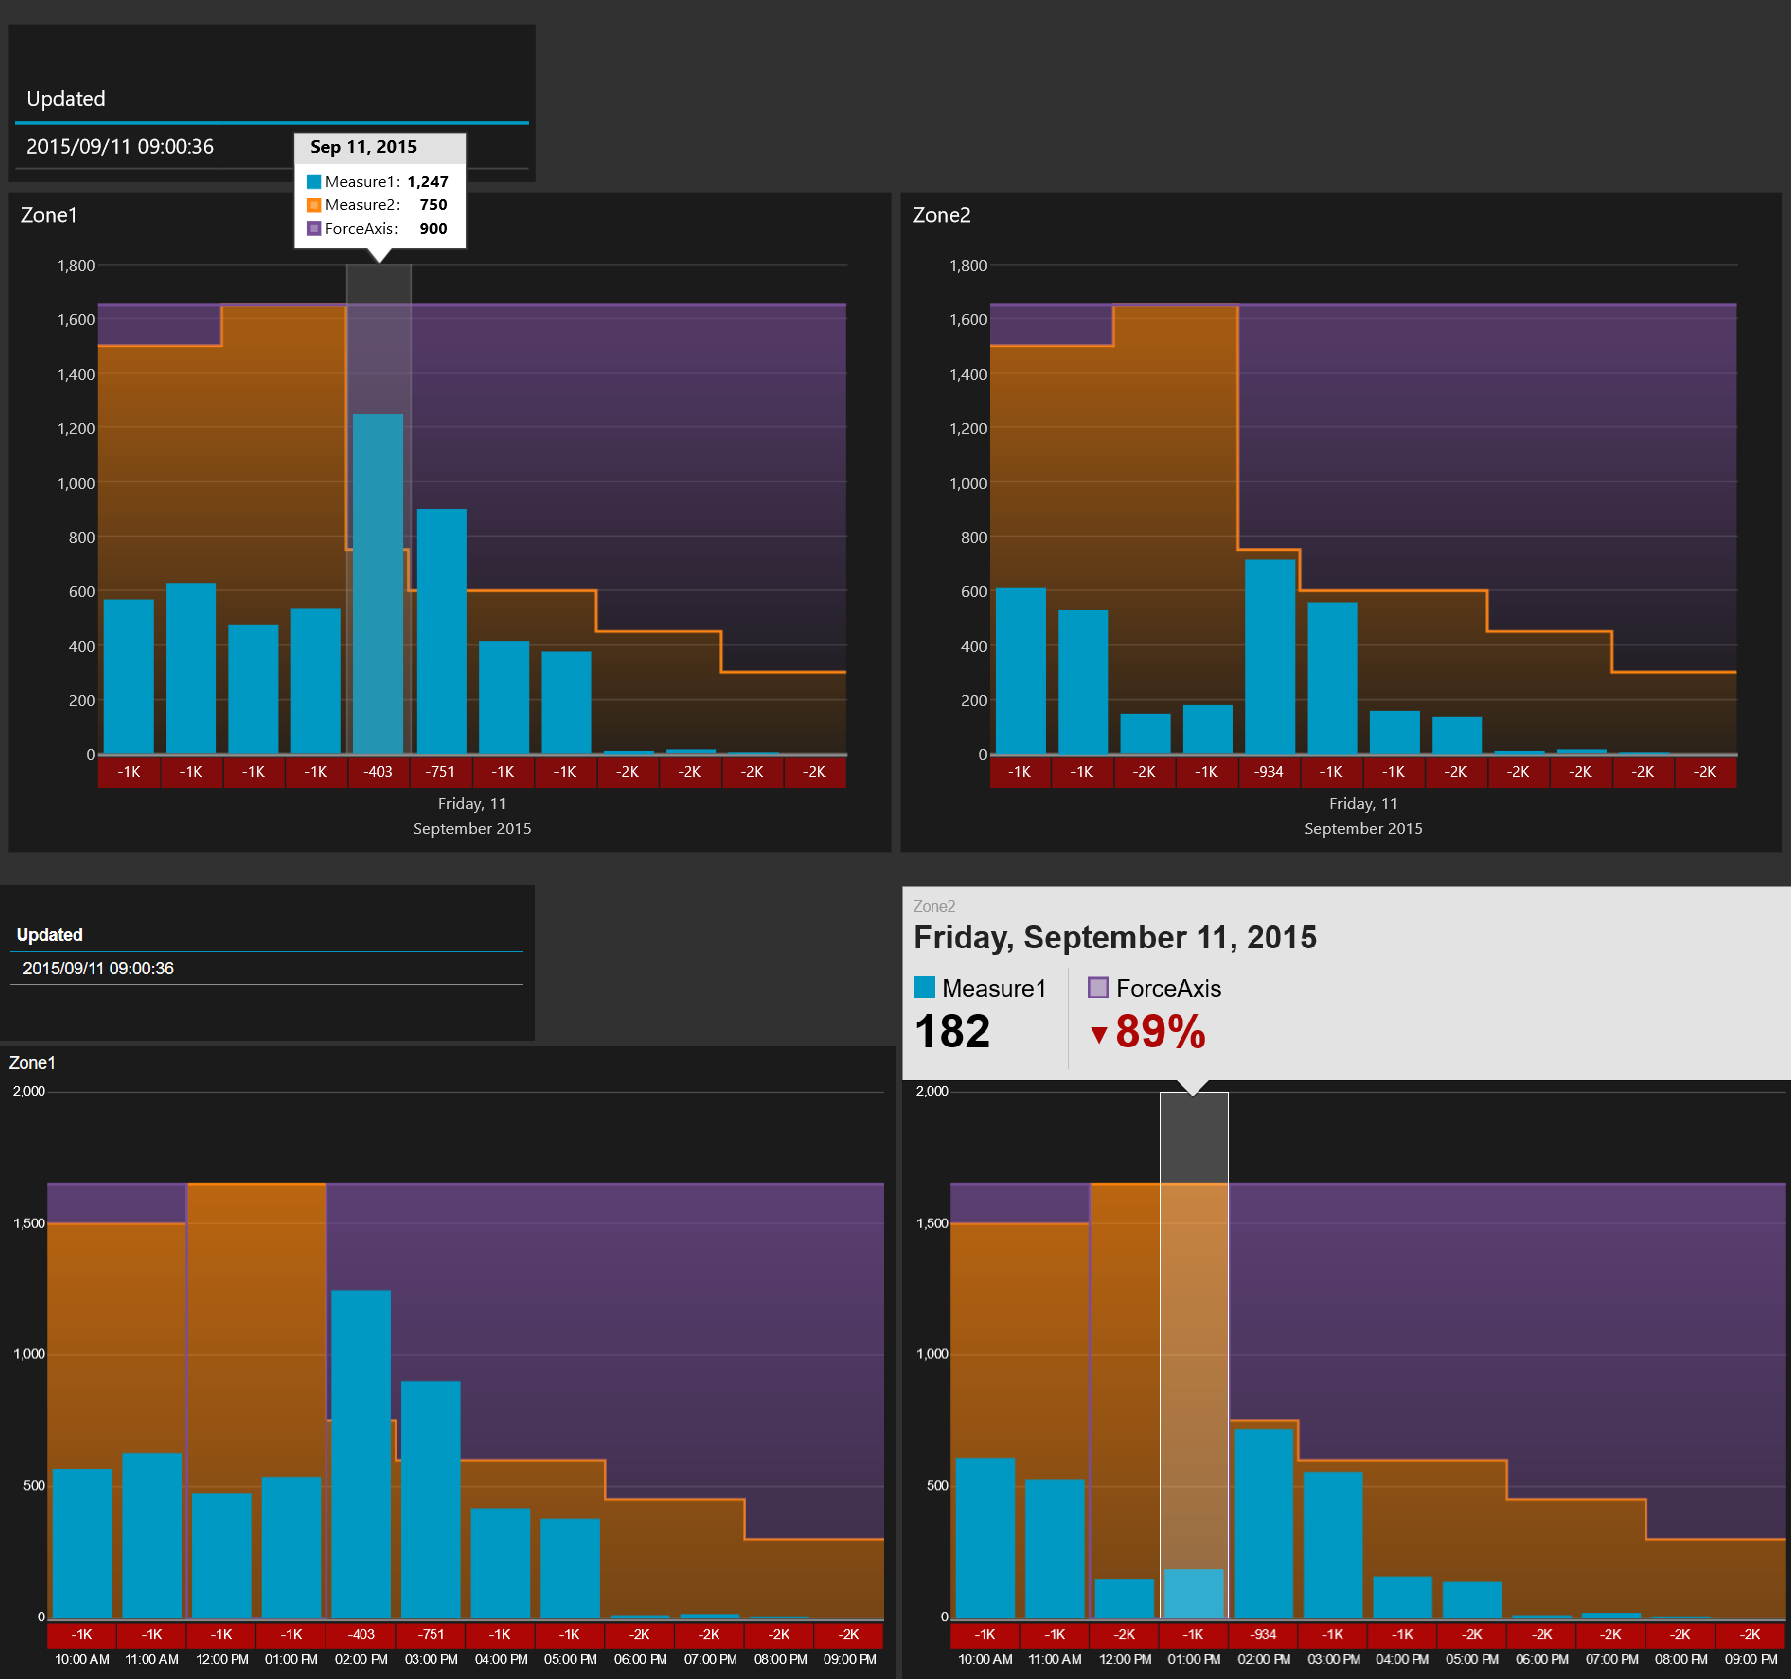
First issue is that the axis’ are data driven, which is a nice feature in general, but in this case I need them to use the same axis’ for comparison reasons so I really wish I could have fixed axis’, or be able to use a third measure to define the y-axis. In this case I ended up calculating a third measure to force the graphs to have same y-axis based on the higest value in one of them. So I am now comparing measure 1 with measure 2 AND another measure to push the y-axis. This affects the comparison values below the chart however and wil now never go above 0. If i could chose to remove that difference value that wouldn’t be a big problemas the user could just use the graph, but I am not able to that.

Request 2: Same information in all viewers

Below I have the output from the Win8 app in the top of the image and the web browser viewer at the bottom. They clearly are showing different information. I want the hours to be displayed as in the browser viewer, but I want the tooltip from the Win8 viewer. I want to see the values of each measure, or at least have the option to do this. The browser is also only showing the label of one of the two masures I am actually comparing to.

DifferentBehaviour

Part 2: Real time dashboard using a Raspberry PI and Power BI

Part 2: Using the Power BI API to make a real time dashboard

So you have set up your Azure Active Directory and created a Power BI provision for your organization? If not, you can have a look at part one of this series.

Before we start playing with the Raspberry PI let’s create a simple console application to see that we have set up things correctly in Azure Active Directory in the last post and are able to have real time updates on a dashboard in Power BI. Nothing advanced, but it is a nice test to see if we have set everything up correctly with our Azure account and Power BI. What we will do is create a dataset if it does not already exist in Power BI and insert rows of data into that dataset which will then update the dashboard in real time.

Creating a Power BI application

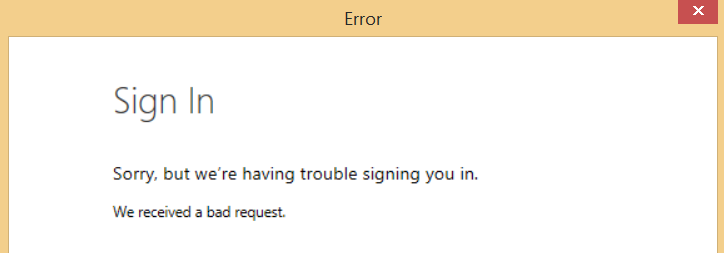
If you want to take the easy way out to see if you have set up everything correctly you can download a test code made by the MSDN team on github here: https://github.com/PowerBI/getting-started-for-dotnet. After downloading this code you need to insert your own Client ID that you get from your application page in Azure. You also need to set the redirect URI to the same as your application, if you don’t do this you will get an error message like the one below.

BadRequest

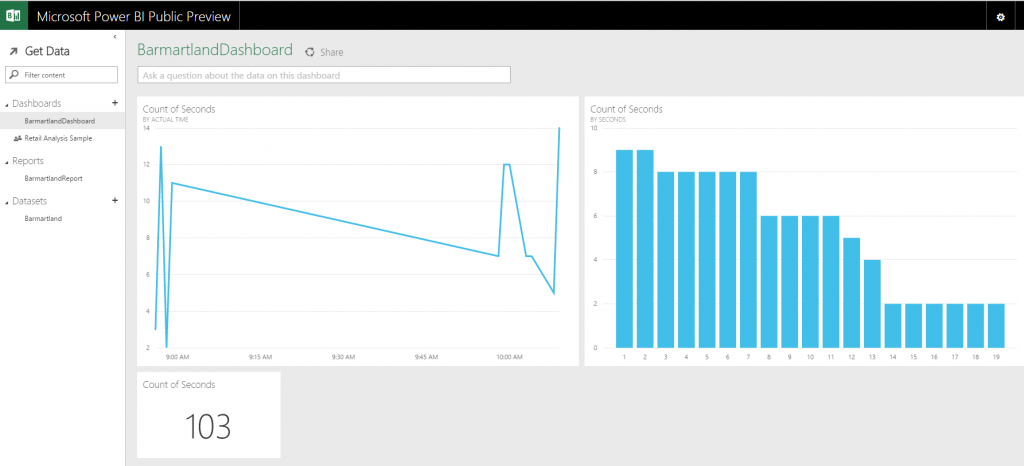
When you run the code you will see a green star-thingy appear to the right of your newly created dataset. After the dataset is created you can go and explore that dataset, even if it’s empty, and create a report. From the report you then pin report elements to a dashboard and when you run your application you will see the elements update real time. Nice!

NewDataset

I would suggest that you, either if you choose the easy way out or make a new application  from scratch, do some playing around and create your own dataset and insert some rows into it so you get a better understanding on what is happening and how the Power BI API works. Getting a good understanding of how datasets and inserting rows work will be useful later. We will not be able to reuse the dataset in the example code when using our Raspberry PI so we need to be able to create our own datasets, turn them into JSON and then insert some data. What you create is completely up to you and your imagination. I made a new application from scratch with a simple timer that  every second writes how many seconds it has been running, along with a timestamp, to Power BI. Does it provide great insight? Do I change how we look at this world? No, but it has provided me with some valuable hands on experience with the Power BI API. Other examples I’ve seen people doing is for example looking at clicks on a website and what device the clicks come from. Again it is completely up to you what you want to do.

Next up we will start to play with the Raspberry PI and then connect it to Power BI.

Dashboard

NOTE: When writing to a Power BI dataset there is, at the point when this post was written, no option to export a dataset from the Power BI Preview. This means that if you want to be able to use the data in another format than Power BI you need to store it another place as well. I am going to create an Azure SQL Database to store my data when using the Raspberry PI in case I want to use it other places other than PowerBI. Maybe you should consider doing the same?

Other parts of the series can be found here:

Part 1: Real time dashboard using a Raspberry PI and Power BI