Datazen lets you create and use custom maps which can be a really useful feature. What I am using for creating these maps is good, old Paint, internet and QGIS, which you can download here, http://www.qgis.org/en/site/forusers/download.html.
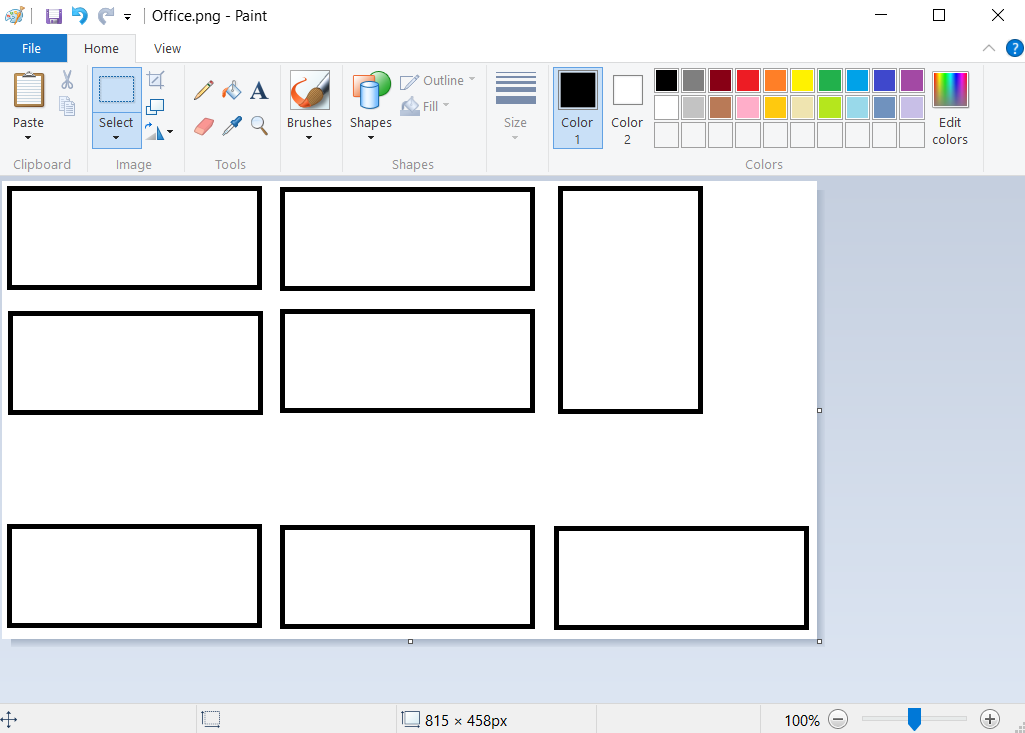
Say you want to create a map of your office. Maybe not the most useful map, but it is a small job to create an office layout in paint so lets start there. You can use other images as your starting point, but I want to make the entire thing from scratch to show that it is possible. My office will look like the one below with eight tables that I am going to map to different persons so we can see who actually does some work around the office! (None, of the names or data is real just to be sure)
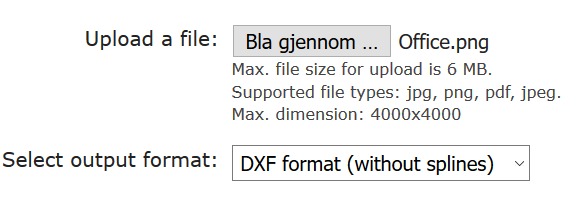
Next we need to convert this .png file to a vector file. I’m using http://www.autotracer.org/ for this, but there are other methods of doing it, software, other websites etc. Upload your file and make sure to choose DXF format on your output file.
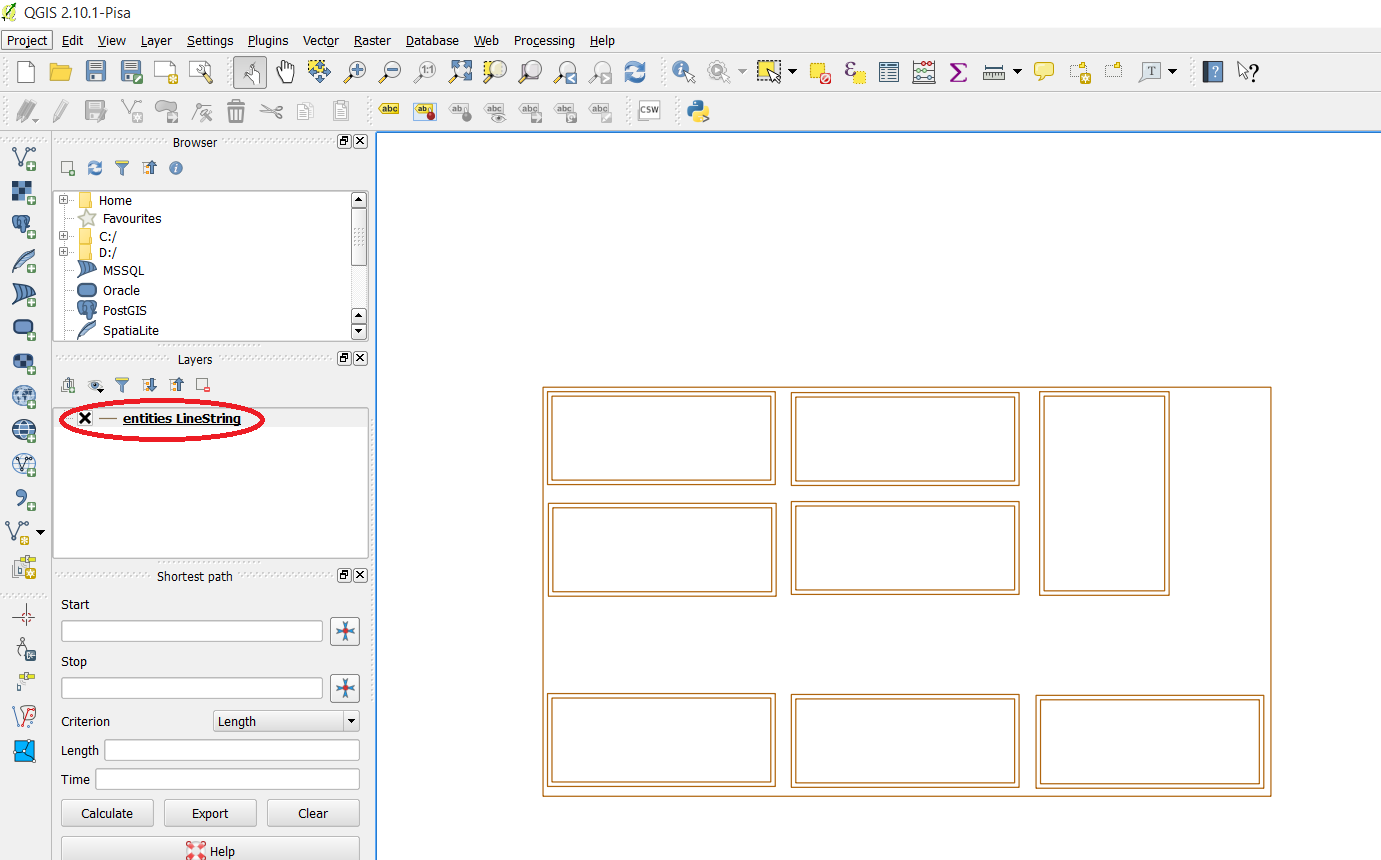
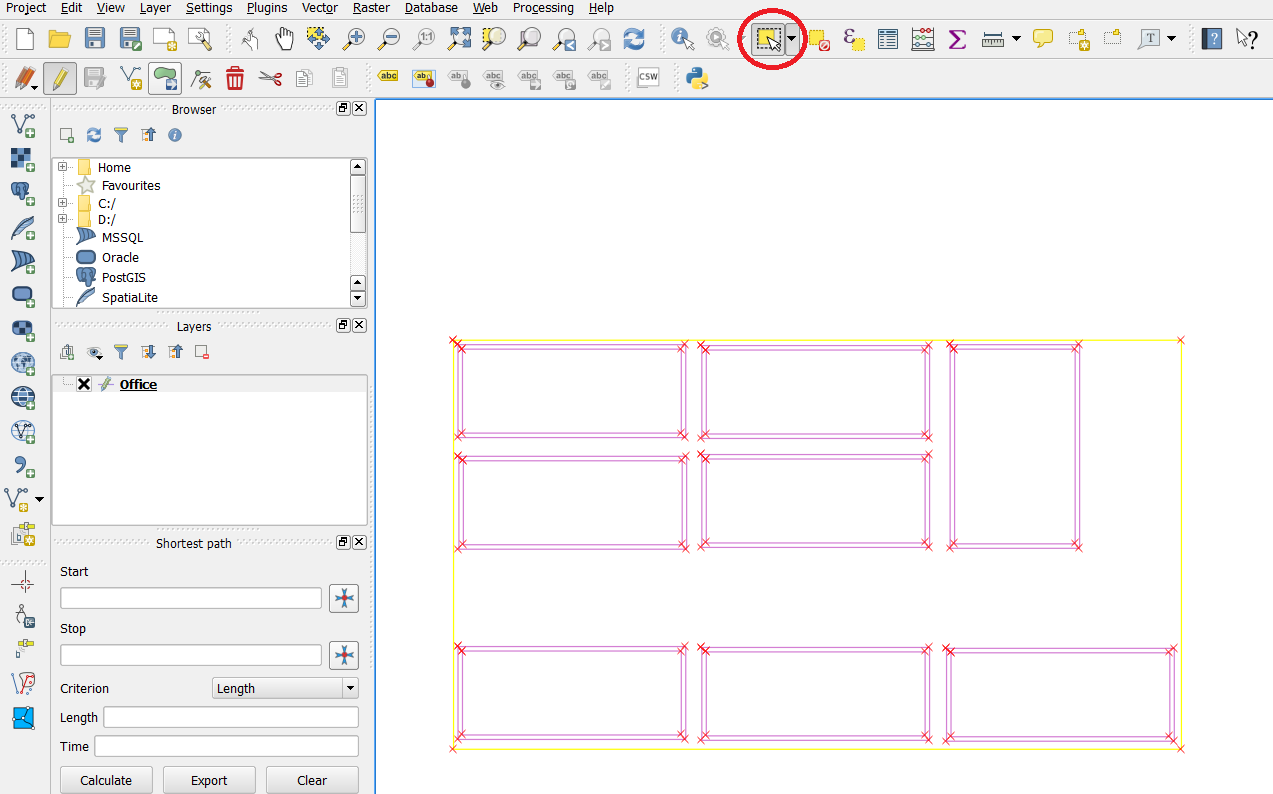
Now that we have a vector file of our office lets open up QGIS and just drag the .dxf file into it. Choose the default coordinate system and the layer with geometry type “linestring”. You should now have something like this in Qgis.
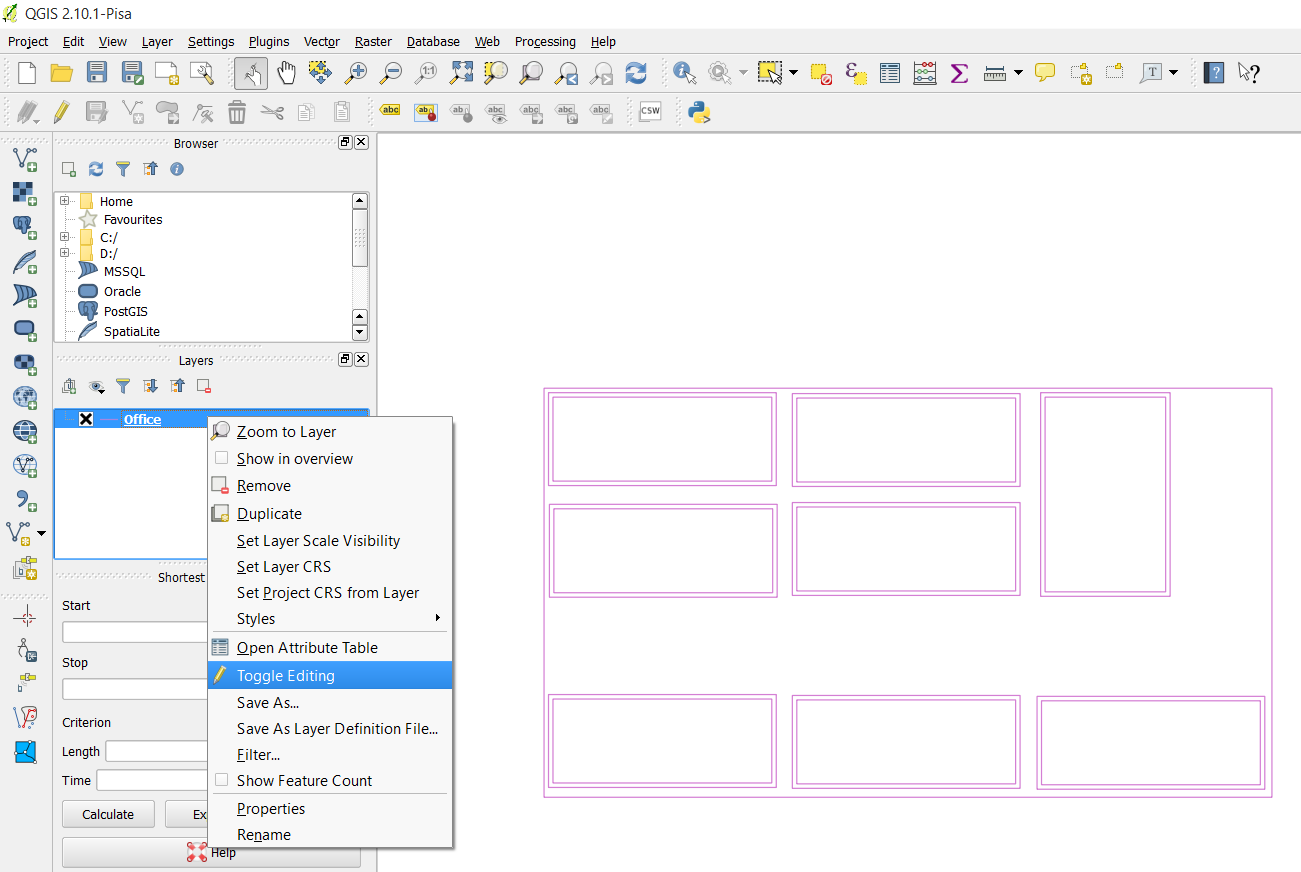
Right click your layer, choose “save as…” and choose ESRI shapefile in the popup. When this is done you can right click your “linestring” layer and remove it. We are now going to edit the shapefile a little to make it simpler and also give the different shapes the name of people in our office so we can map data to their names. Right click the layer and press toggle editing. You are now able to edit, merge or delete sections. We can see that our vector image has some double lines around each desk, probably because we used to thick of a brush in paint so lets remove them.
Find the “Select Feature” on your toolbar and select a section of your layer. This section becomes yellow and you can delete it. After deleting some of the sections I end up with a simple layer with eight squares, my office desks.
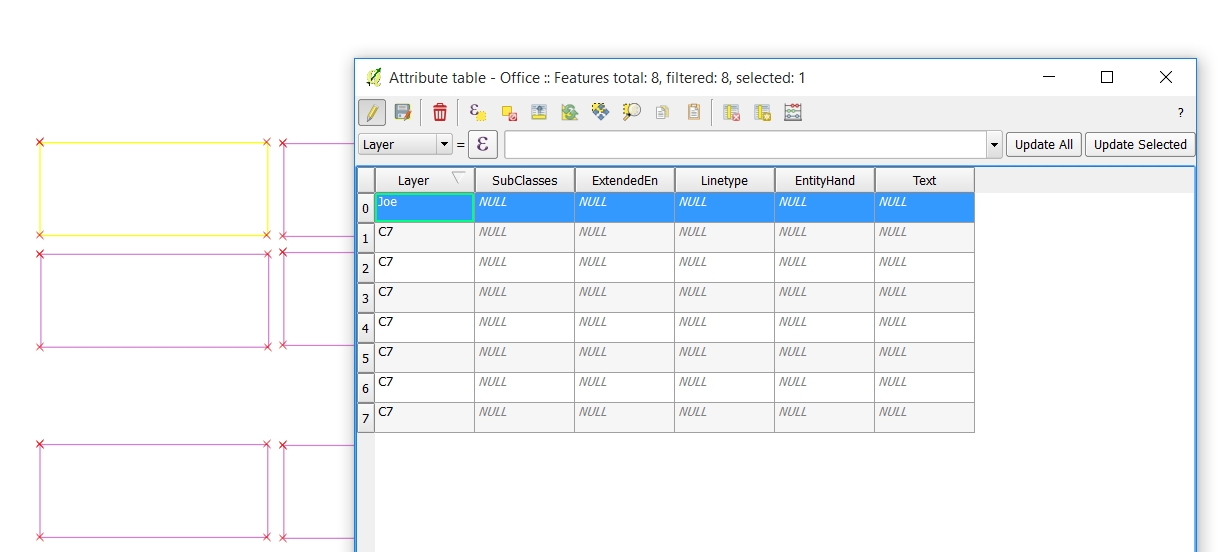
We need to give the shapes some more friendly names. Right click your layer and select “Open attribute table”. You get a popup and in my case I see that all my shapes has the name C7 in the layer column. I’m going to select a row in this attribute table, and see that by doing this the related section in my layer behind turns yellow. I now know which section I am editing and I’ll say that Joe works by this desk. Then I do the same for the rest of the sections.
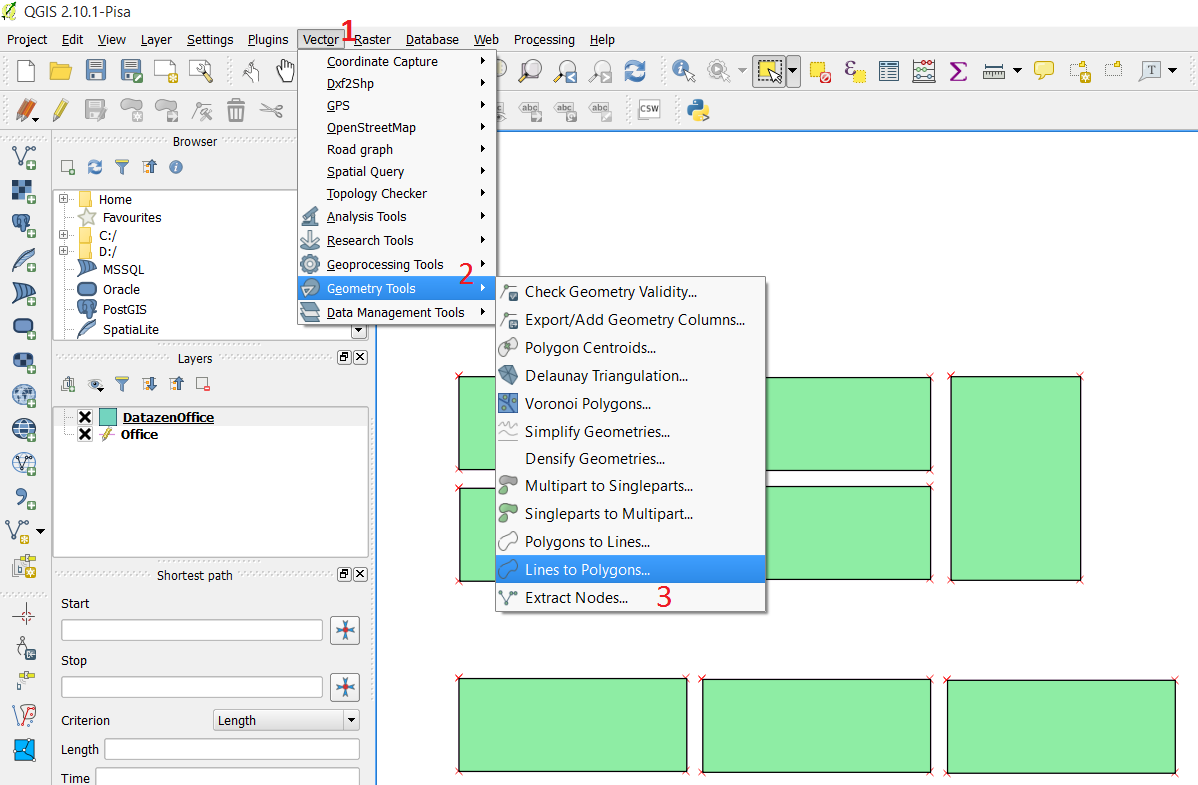
Save your layer after giving all rows a name. One more step and it is ready to be imported into Datazen. If you try to import it at this stage your data will only end up on the lines of the desk and it is REALLY hard to see what color it has. Press Vector -> Geometry tools -> Lines to polygon to make your lines into polygons, an area. You will need to create a new output shapefile and save that.
Alright, time to open up Datazen. Drag a map of your choice onto the Layout View, select “custom map from file” and find your shapefile. You will need the .shp and the .dbf file. Note: You can not have the shapefile open in QGIS at this point. It’s like reading from an Excel file, you can’t have it open when adding it to Datazen.
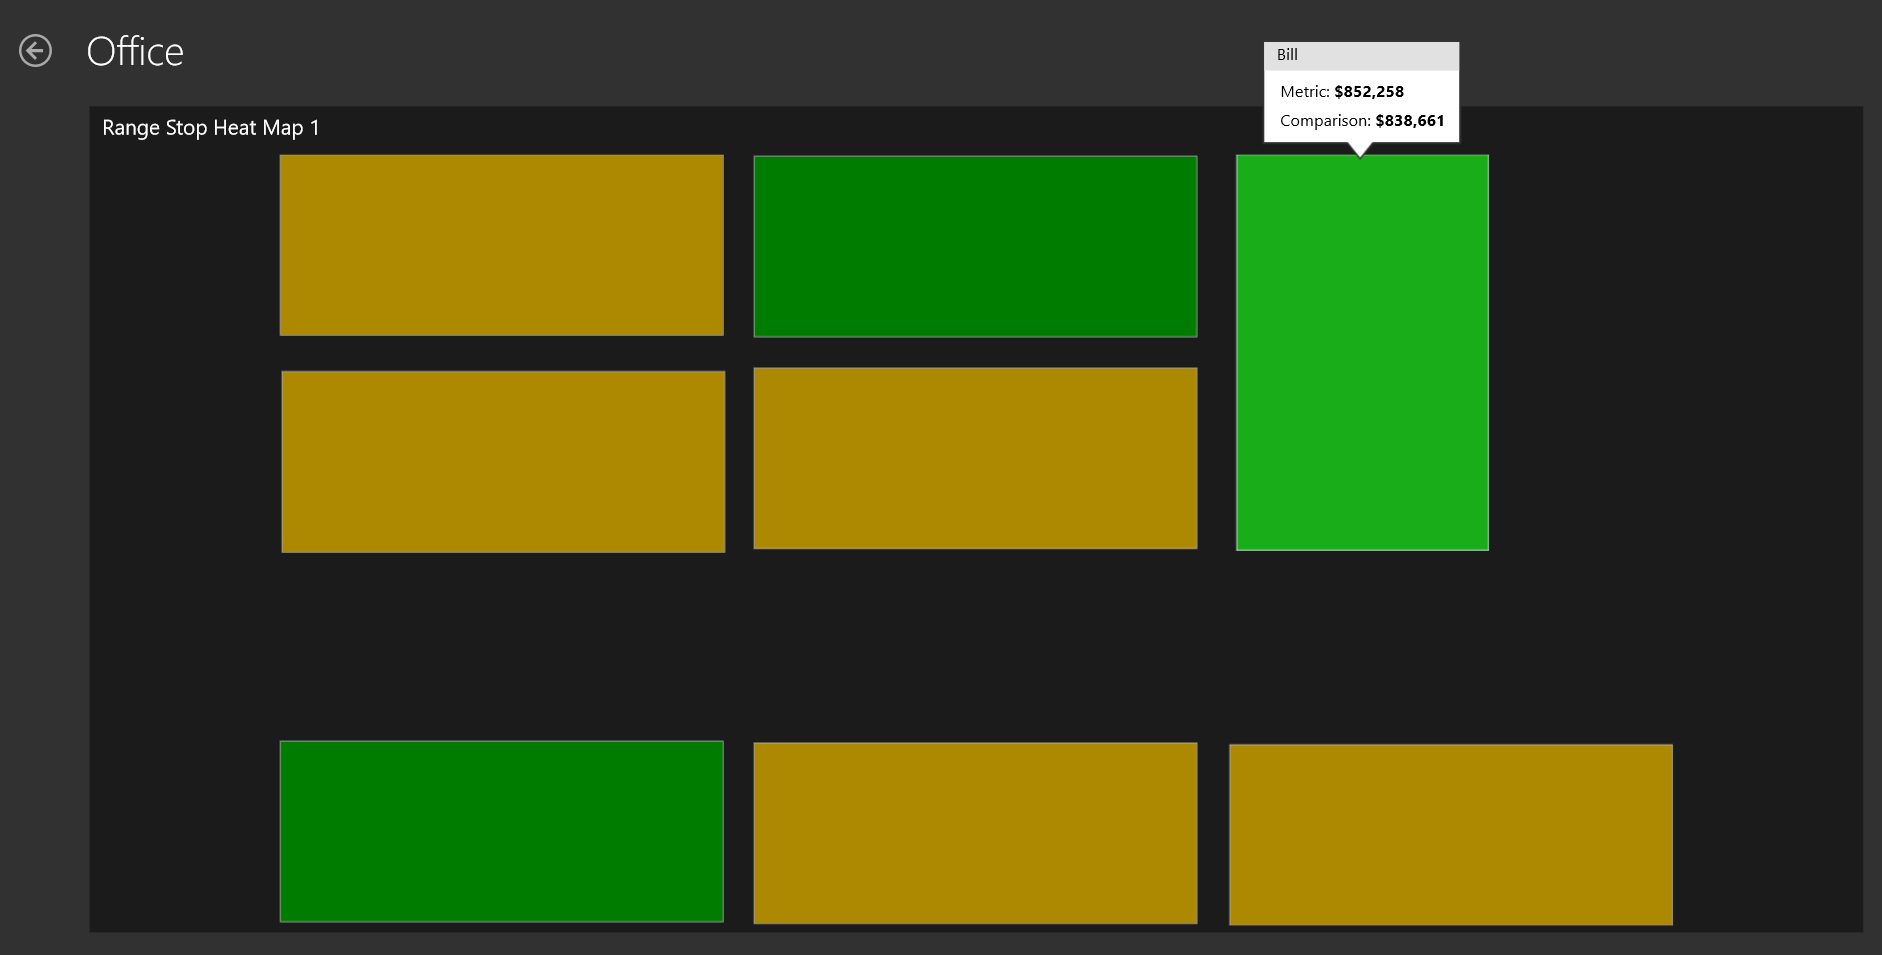
Press preview, and voila! You have created a map and inserted it into Datazen. Have fun, now the only limit is your mind or your customers need!
Hey,
thanks for the post, helps me a lot.
But i have a problem with that, can you help me?!
When i created a new map, like you, with only squares, worked. But if i have more nodes on my square, or i include on picture with a lot of nodes, dosent worked.
Do you now why this happens?!
Plese, i need so much your help.
Thanks a lot, and sorry about my english .
o/
Olavo
how to import a map file in datazen ?
what will be format and maximum size of map file to be imported?
@uttam, after creating your .dbf and .shp file you can do one of two things to use the map in Datazen. It has to be in this format.
1) Upload the .df and .shp file to the Datazen server. You can do this in the control panel. Then everyone with access to the HUB you uploaded it will have access to it.
2) Use the .dbf and .shp from a local machine.
In either way you choose the map you want to use, and where it says “Map” on the control you scroll down until you see “Custom map from file” if the files are locally, or “Custom map from Datazen server” if you’ve uploaded them.
Maximum size for your files is 512KB. This can be a challenge at times, but there are websites that can help with simplifying .shp files when you have them.
thank youuuuuuu
very Gooood
Amazing work .. thanks
Nice to see that you still can help me, even if we are not in the same company any longer. Thank you for this post!
*Thumbs up*! 🙂
Thanks for the article,
i did the same, i can see the map loaded but no data plotted on the map, can you share the excel file which is used?
Regards
Unfortunately I do not have the Excel file with the data anymore as this is over a year ago. The mapping key in the Excel file should be equal to the name of each row in your layer.
I remember when I did this on my first try the borders where to thick so the data got mapped to the borders and it would look like there where no data there. So make sure you have removed any excessive lines in doing the step to turn lines to polygons.