Tag Archives: Technical

Retry Failed Connections in Talend

In a project we are using Talend to load a lot of data each night and we are experiencing randomly getting “Connection does not exists” error messages during our data load. This can happen at any time both during the connection phase, and so far we have been unable to see any real signs of why it is happening and when. In addition this leads connection reset often leads to our data being corrupt and unusable meaning we have to start all over. We have therefore set up an error handling when reading from this data source.

Setting up a try/catch in Talend

  1. Create a context variable that we call continueLooping. This boolean will be used to end our loop when we reach our maximum number of attempts or the connection has been successful
  2. Add a tJava where you initialize the variable to true
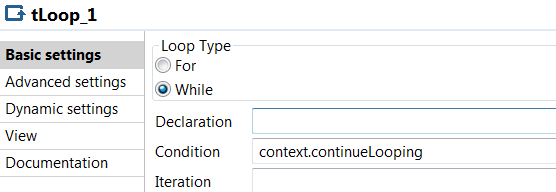
  3. Then add a tLoop as a While and condition context.continueLooping
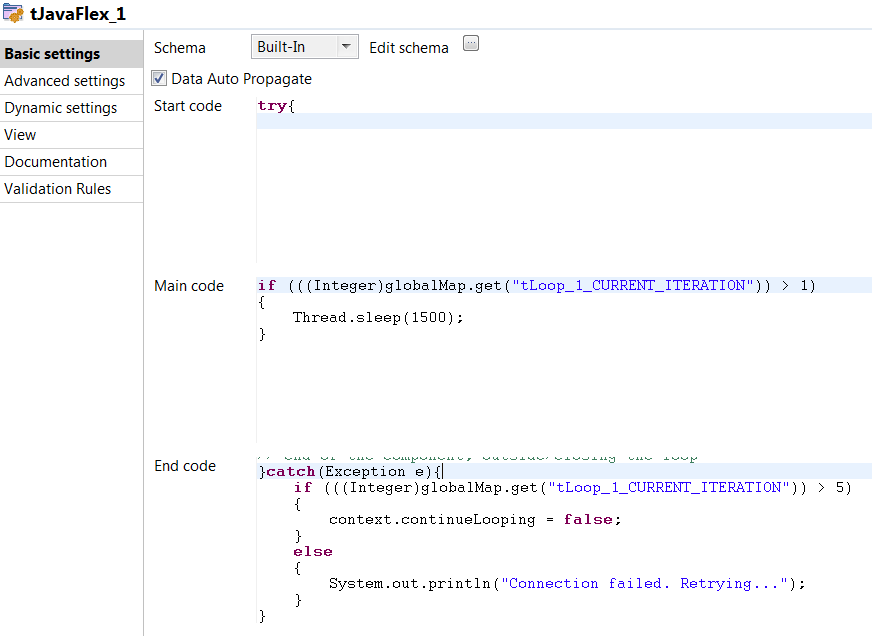
  4. Now we add a tJavaflex where our try/catch block will be. Put the try block in the start code and the catch block in the end code. Mine look something like this. Feel free to add some logging in here as well so you can keep track of where the error is happening. in the main code I make the job sleep for a little while in order to give our connection some time to get back up.
  5. Add a tJava with a “On component Ok” trigger on your database connection. Here set the continueLooping to false to stop the loop.

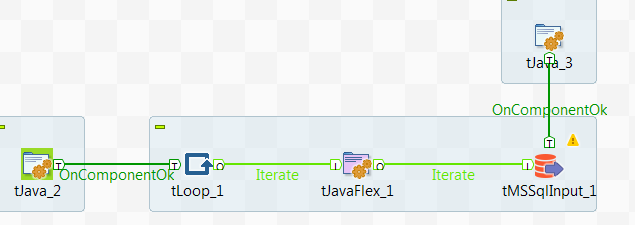
In the end it should look something like this:

Extending the error handling

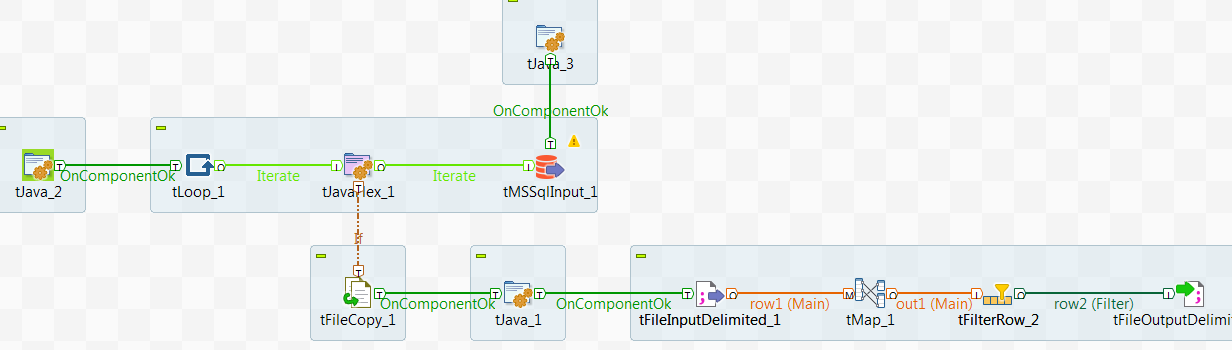
In our case we are already looping our read by using a job above this one to read data one month at a time. The output of this job is large .csv files which we then upload to Azure blob storage in order to use Polybase to finally move the data into our SQL DWH data warehouse. Since we know we can loose connection in the middle of our read we need to clean up our .csv files before starting the loop all over for the month that we are reading. This is done by adding an If trigger on the tJavaflex where our trigger is to check which iteration we are in. If we are not in the first iteration of our loop something has gone wrong and we need to do some cleanup to make sure our data is correct in the end. We therefore remove all rows for the month we are supposed to read before we let the loop start over. Now, the only way I have been able to do this is by creating a copy of our existing file, filter out rows for current month and then write it back as the original file. In the end it looks like this:

Overall it seems to work very nicely when we are unable to trust that our data source will keep our connection open for the whole duration.

Creating a dynamic card with text value in Power BI

Alternative title: Finding string value from a dimension with highest numeric value

The company i work for uses Yammer and I have founded a Data Visualization group which I am, manually, keeping some statistics about using Power BI. The other day I found myself wanting a dynamic card in Power BI in order to highlight which day was the most active when it came to amount of posts. In order to do this I had to figure out how to make a measure returning not the max value, but the day which had the maximum amount of posts. My usecase is finding a weekday, but maybe you want to see which product is the most popular, which county has the most purchases or which salesperson has the most sales. All these cases should be able to reuse this measure.


First try

My inital thought was to create a table in my calculation and then slice it to return only one row and one column leaving me with one cell which had the day with the most number of posts. I made a measure which used a TOPN returning the row with most posts followed by a SELECTCOLUMN to select only the column which had the weekday in it. Now, this turned out to return me the overall correct day, but it did not work when I added a filter and the POwer BI visualization returned errors so I had to start over.


The solution

I have created three measures to solve this.

1) One simple sum of [Number of Posts]:


Number of Posts = SUM(Sheet1[NumberOfPosts])

2) Finding the day with the most posts by using MAXX


MaxPostsPerWeekDay = MAXX(VALUES(Sheet1[WeekDay]);[Number of Posts])

3) Using FIRSTNONBLANK on my WeekDay column and then return the value where the sum equals the maximum value. So in the end my measure looks like this.

Most Popular Day = 
IF(
    ISBLANK([Number of Posts]);
    BLANK();
    FIRSTNONBLANK(
        Sheet1[WeekDay];
        IF(
            [Number of Posts] =
            CALCULATE(
                [MaxPostsPerWeekDay];
                VALUES(Sheet1[WeekDay])
            );
            1;
            BLANK()
        )
    )
)

The first IF is to remove days that has no posts, in my case there is not much activity in the weekends so they will get filtered out. The beauty of this measure is that it is not limited to crads, but also easy to use with your filters and in tables where you would want it.

Datazen Guest Authentication Will Be Missed

About a week ago a blog post was released called “Announcing End of SUpport for Datazen Products“. Now, this shouldn’t come as a surprise since Datazen is a part of Reporting Services in SQL Server 2016, more specifically mobile reports. Overall this is great news, there was however a few points I was a bit disappointed in seeing was not part of the initial release.

A really great thing that is mentioned is that a focus area has been that Datazen customers should be able to migrate to SQL Server 2016 Reporting Services easily. This is great, no need in recreating everything you have done so far, and there has been mentioned a migration tool earlier so I hope this will be a simple case once customers start migrating HUBs, users and dashboards.

My biggest dissapointment was to see that Custom authentication and Public/guest authentication is not part of the initial release, but at least on the roadmap. I have struggled with SSRS on public webpages before, and Datazen gave me an easy way of doing this. Hacking a way so that a public Sharepoint portal had to impersonate a user when a user went to pages with SSRS elements was not an easy task, and that hack also did not work when the site was migrated from SharePoint 2010 to SharePoint 2013 so we had to do it all over again. And this was even the solution that Microsoft themselves said we should go for!

Authentication via SSRS have some clear advantages, but I’m still dissapointed that there was not room for guest authentication. In the end, a lot of information is usable and important for the public, and if it is not seen what use is it? I’m crossing my fingers that this will be implemented relatively quick. If we’re lucky maybe they are able to let us use SSRS paginated reports on public sites as well!