Category Archives: PowerBI

One way of auto refreshing Datazen in your browser

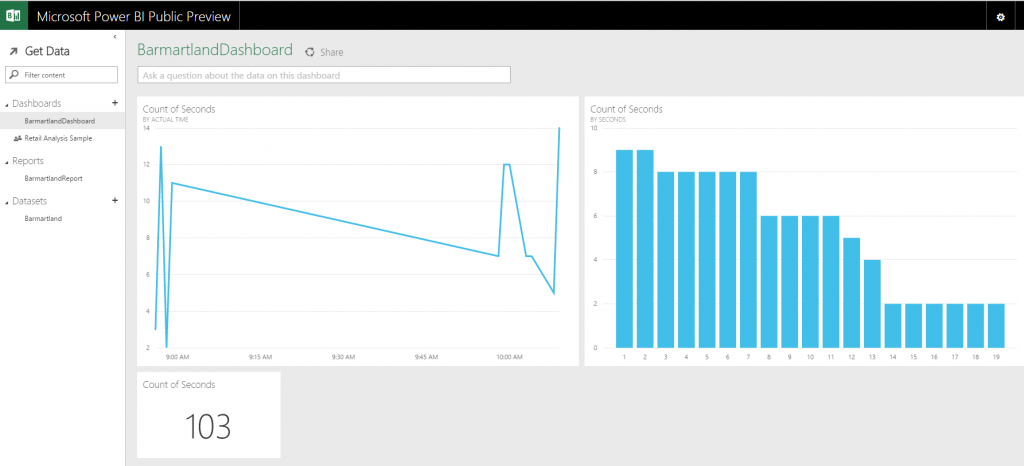
Yesterday I saw Christopher Finlan tweet about one way of making your Datazen dashboard auto refresh. He used a Firefox add-in for this, and I’d like to show you how I have been doing this.

If you want to show Datazen on a big screen there is at this point no out-of-the-box way to auto refresh your dashboard, meaning you have to open it to get new data. If you use the browser viewer you can quite quickly create one of the simplest websites in the world to do this.

In the header of your .html file add the following line:

<meta http-equiv="refresh" content="90" />

It will make your page refresh every 90 seconds. This can also be used if you want to circle some of your dashboards, sort of like a carousel. The line below will after 30 seconds go to the specified URL instead of just refreshing the page. To complete the circle make sure to go to the first dashboard in your last dashboard.

<meta http-equiv="refresh" content="30; URL='NextDashboard'">

So what does the .html file look like for the easiest example? Something like this, just exchange “DashboardURL” with your URL:

<!DOCTYPE html>
<html>
<head>
<title>Name of Dashboard</title>
<meta http-equiv="refresh" content="90 ">
</head>
<body style="margin:0px;padding:0px;overflow:hidden">
<iframe src="DashboardURL" frameborder="0" style="overflow:hidden;overflow-x:hidden;overflow-y:hidden;height:100%;width:100%;position:absolute;top:0px;left:0px;right:0px;bottom:0px" height="100%" width="100%"></iframe>
</body>

Note: If you are going to setup an auto refresh I’d suggest you also set up your guest account so you can have access to those dashboards without having to login. You can then use the public dashboard URL in the source of your iframe.

Creating a custom map for Datazen

Datazen lets you create and use custom maps which can be a really useful feature. What I am using for creating these maps is good, old Paint, internet and QGIS, which you can download here, http://www.qgis.org/en/site/forusers/download.html.

Say you want to create a map of your office. Maybe not the most useful map, but it is a small job to create an office layout in paint so lets start there. You can use other images as your starting point, but I want to make the entire thing from scratch to show that it is possible. My office will look like the one below with eight tables that I am going to map to different persons so we can see who actually does some work around the office! (None, of the names or data is real just to be sure)

Office

Next we need to convert this .png file to a vector file. I’m using http://www.autotracer.org/ for this, but there are other methods of doing it, software, other websites etc. Upload your file and make sure to choose DXF format on your output file.

convert

Now that we have a vector file of our office lets open up QGIS and just drag the .dxf file into it. Choose the default coordinate system and the layer with geometry type “linestring”. You should now have something like this in Qgis.

qgisOutline

Right click your layer, choose “save as…” and choose ESRI shapefile in the popup. When this is done you can right click your “linestring” layer and remove it. We are now going to edit the shapefile a little to make it simpler and also give the different shapes the name of people in our office so we can map data to their names. Right click the layer and press toggle editing. You are now able to edit, merge or delete sections. We can see that our vector image has some double lines around each desk, probably because we used to thick of a brush in paint so lets remove them.

toggelEditing

Find the “Select Feature” on your toolbar and select a section of your layer. This section becomes yellow and you can delete it. After deleting some of the sections I end up with a simple layer with eight squares, my office desks.

SelectFeature

We need to give the shapes some more friendly names. Right click your layer and select “Open attribute table”. You get a popup and in my case I see that all my shapes has the name C7 in the layer column. I’m going to select a row in this attribute table, and see that by doing this the related section in my layer behind turns yellow. I now know which section I am editing and I’ll say that Joe works by this desk. Then I do the same for the rest of the sections.

Attribute

Save your layer after giving all rows a name. One more step and it is ready to be imported into Datazen. If you try to import it at this stage your data will only end up on the lines of the desk and it is REALLY hard to see what color it has. Press Vector -> Geometry tools -> Lines to polygon to make your lines into polygons, an area. You will need to create a new output shapefile and save that.

Area

Alright, time to open up Datazen. Drag a map of your choice onto the Layout View, select “custom map from file” and find your shapefile. You will need the .shp and the .dbf file. Note: You can not have the shapefile open in QGIS at this point. It’s like reading from an Excel file, you can’t have it open when adding it to Datazen.

Press preview, and voila! You have created a map and inserted it into Datazen. Have fun, now the only limit is your mind or your customers need!

OfficeDatazen

Datazen: Brand package error

EDIT: If you want to get a brand package template you can find one here.

Do not copy/paste filenames for a brand package directly from the Datazen “End User Documentation”! Some of the dashes are em dashes and is not recognized by the server when you try to upload the .zip file with all the images. It will result in the following error message. You can see that the character in red circle which looked like a dash is now read as a û.

InvalidCharacter

Now, this wouldn’t be too bad if it wasn’t for the fact that I am now unable to delete this brand package as shown below. I uploaded this package to the server and I can upload another brand package to my individual HUBs, but for now I have yet to be able to delete the faulty brand package. I’m guessing I need to be able to access the RavenDB and delete it from there, but since this is a test server without a lot of dashboards I think I’ll just reinstall the server and start from scratch again.

deleteError

Part 2: Real time dashboard using a Raspberry PI and Power BI

Part 2: Using the Power BI API to make a real time dashboard

So you have set up your Azure Active Directory and created a Power BI provision for your organization? If not, you can have a look at part one of this series.

Before we start playing with the Raspberry PI let’s create a simple console application to see that we have set up things correctly in Azure Active Directory in the last post and are able to have real time updates on a dashboard in Power BI. Nothing advanced, but it is a nice test to see if we have set everything up correctly with our Azure account and Power BI. What we will do is create a dataset if it does not already exist in Power BI and insert rows of data into that dataset which will then update the dashboard in real time.

Creating a Power BI application

If you want to take the easy way out to see if you have set up everything correctly you can download a test code made by the MSDN team on github here: https://github.com/PowerBI/getting-started-for-dotnet. After downloading this code you need to insert your own Client ID that you get from your application page in Azure. You also need to set the redirect URI to the same as your application, if you don’t do this you will get an error message like the one below.

BadRequest

When you run the code you will see a green star-thingy appear to the right of your newly created dataset. After the dataset is created you can go and explore that dataset, even if it’s empty, and create a report. From the report you then pin report elements to a dashboard and when you run your application you will see the elements update real time. Nice!

NewDataset

I would suggest that you, either if you choose the easy way out or make a new application  from scratch, do some playing around and create your own dataset and insert some rows into it so you get a better understanding on what is happening and how the Power BI API works. Getting a good understanding of how datasets and inserting rows work will be useful later. We will not be able to reuse the dataset in the example code when using our Raspberry PI so we need to be able to create our own datasets, turn them into JSON and then insert some data. What you create is completely up to you and your imagination. I made a new application from scratch with a simple timer that  every second writes how many seconds it has been running, along with a timestamp, to Power BI. Does it provide great insight? Do I change how we look at this world? No, but it has provided me with some valuable hands on experience with the Power BI API. Other examples I’ve seen people doing is for example looking at clicks on a website and what device the clicks come from. Again it is completely up to you what you want to do.

Next up we will start to play with the Raspberry PI and then connect it to Power BI.

Dashboard

NOTE: When writing to a Power BI dataset there is, at the point when this post was written, no option to export a dataset from the Power BI Preview. This means that if you want to be able to use the data in another format than Power BI you need to store it another place as well. I am going to create an Azure SQL Database to store my data when using the Raspberry PI in case I want to use it other places other than PowerBI. Maybe you should consider doing the same?

Other parts of the series can be found here:

Part 1: Real time dashboard using a Raspberry PI and Power BI

Part 1: Real time dashboard using a Raspberry PI and Power BI

Part 1: Setting up Azure Active Directory and registering your application

When the Power BI preview finally was released I was really intrigued by the Power BI API which among other things allow you to create dashboards that are updated in real time. Now, I am expecting my first child in under a month now and I thought that why not combine my background in cybernetics and embedded systems with my present, business intelligence. I have bought a Raspberry PI and I invite you to join my mission to hopefully create a baby sound monitor that will be updating a Power BI dashboard in real time to show how often, how loud and how long my baby is crying. Hopefully we will have a quiet baby that never screams and I’ll have to use this for registering baby laughter instead, but who knows right? You might not have a baby on its way, but maybe you have some other IoT project you want to do or just want to try out the Power BI API. Either way you’re invited to embark on this journey together with me!

I will make this into a series of post, but the journey starts with setting up your Azure Active Directory and getting to know the Power BI preview where a dashboard will get updated real time using the Power BI API later. In order to use the Power BI API you need to register the application you will be making in your Azure Active Directory. I also made a new user that I am going to use for my Power BI site.

Creating an Azure Active Directory

When you log into your Azure Management Portal you will find Active Directory on the navigation bar on the left. Click on Active Directory and the new button, choose App Services, Directory and click on Custom Create to create a new AD. Give it a name, a domain name and select the country for your directory. The country can’t be changed after the directory is made and affects which data center your AD will be located in so choose wisely, or just go with the country you’re in as I did.

NewAD
AddDirectory

When your directory is created it will show up under your Azure Active Directories. I have made a new user that I am going to use with Power BI and then signed up for a preview over at www.powerBI.com using this user from my Azure Active Directory. It might take some time to get a Power BI provision up for your Azure Active Directory  organization so I would do this step before you read the rest of this post.

Registering your Power BI app

Before you can create your Power BI application you need to register your app in your Azure Active Directory. Click on the directory you created, go to applications and press add. You want to “add an application my organization is currently developing” and you want it to be a “native client application”. You are asked for a redirect URI where you can use https://login.live.com/oauth20_desktop.srf. Make sure when you start writing your program to use the same redirect URI in your code.

When your application is up you need to set some permissions for it. Click on your application, go to configure, scroll to the bottom of the page and press Add Application. Select “Power BI Service” and close the window. Power BI Service will show up under “Permissions to other applications”, but before you are done you have to check all three checkboxes in the dropdown “Delegated Permissions”.

PowerBIPermissions
PowerBIPermissions2

And with that step: Congratulations! You are now ready to copy/paste the Client ID from your application and start using it together with the Power BI API. We will continue on that later. Feel free to play with the Power BI preview as well to familiarize yourself by f.ex uploading an Excel file as a data source and make some reports and dashboards. Personally I am looking forward to having more visualizations as I almost felt the word preview should have been emphasized more in this Power BI preview.

PowerBIProperties
Other parts of the series can be found here:

Part 2: Real time dashboard using a Raspberry PI and Power BI